Introduction
Modal is a powerful serverless platform for running Python workloads, but integrating observability tools like Datadog APM requires navigating some non-obvious configuration choices. This guide documents how I set up end-to-end tracing for a document processing service, including the gotchas I discovered and the tradeoffs to consider.
Why Datadog APM?
Modal has a native datadog log-forwarding integration, and for most services this is sufficient. However, for complex, distributed applications involving multiple Modal services, external APIs, and third-party systems, APM tracing allows you to have much deeper visibility into performance bottlenecks, error rates, and request flows.
I was load testing my system with Locust and could see there were obvious bottlenecks, but tracking them down with logging alone felt like whack-a-mole. With APM traces, I could see the full request lifecycle, including downstream calls to LLM APIs and database queries.
Understanding Datadog's Sampling Pipeline
Before diving into the setup, it's worth understanding how Datadog's sampling works. A common misconception is that setting DD_TRACE_SAMPLE_RATE=1.0 means you'll be billed for every trace. In reality, Datadog applies sampling at multiple stages:
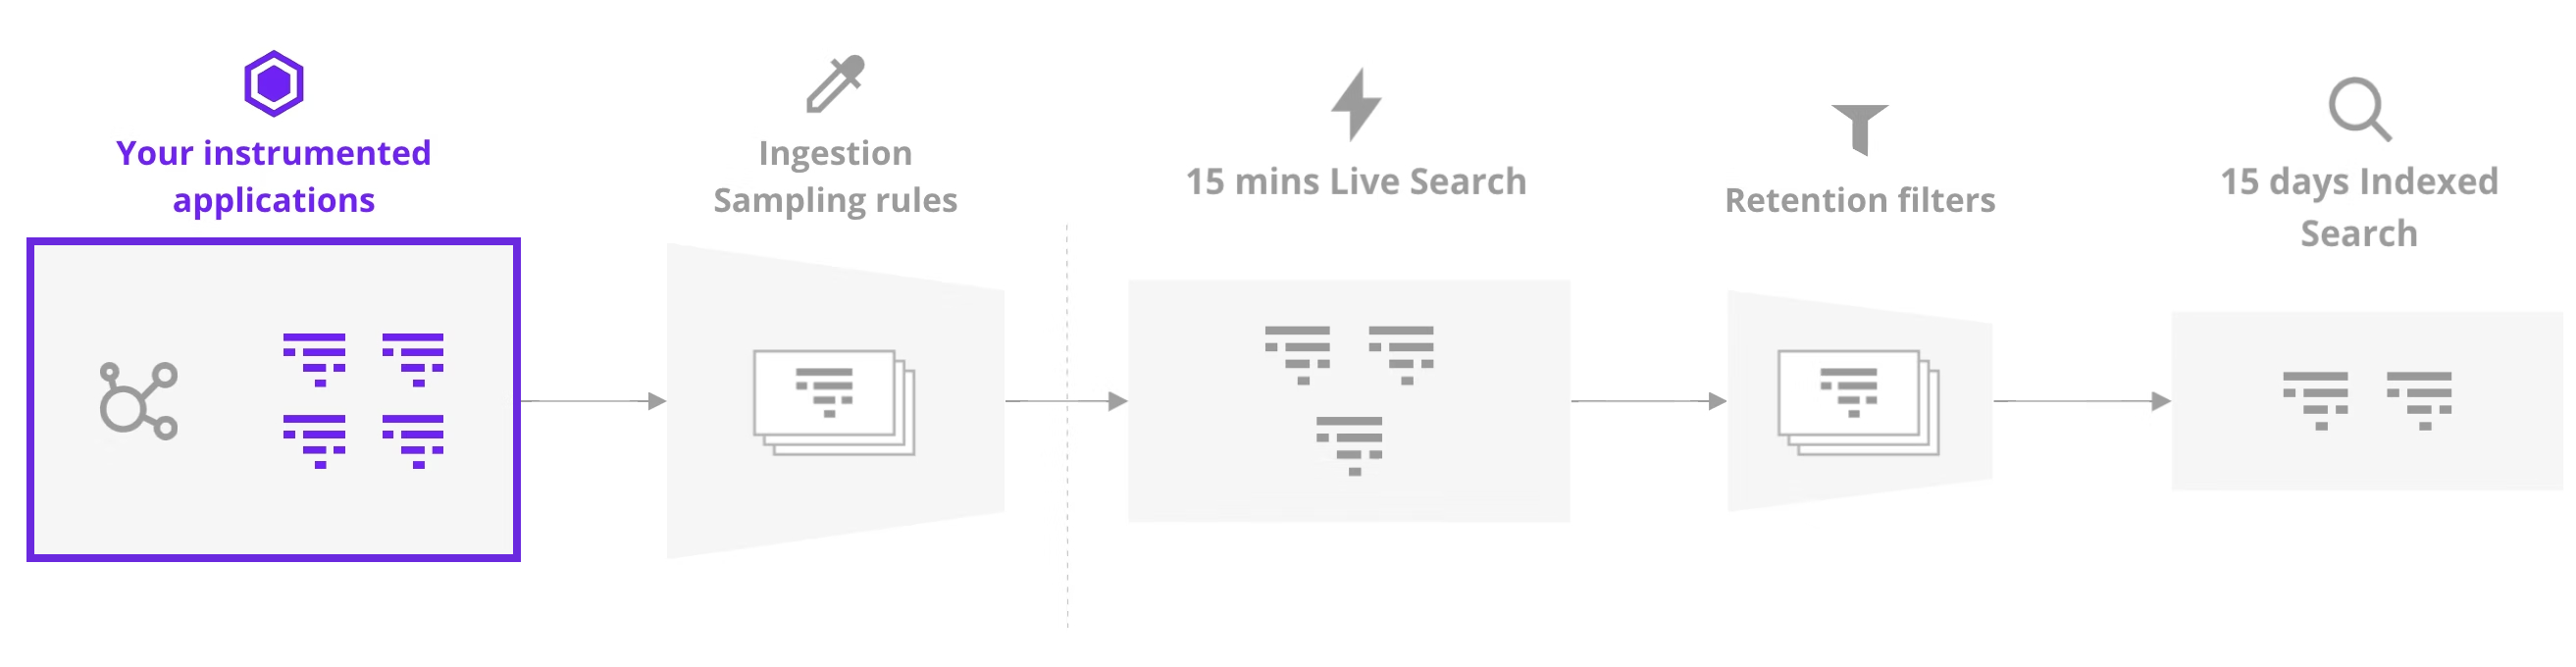
Image credit: utf9k.net
The sampling stages:
-
Application level (
DD_TRACE_SAMPLE_RATE): Controls what percentage of traces your app sends to the agent. Datadog recommends 100% here since you're only charged for retained traces. -
Agent level: The Datadog agent applies its own sampling (~10 traces/sec by default). This becomes important when using Modal's concurrent input handling (see Key Discovery #5).
-
Ingestion: All traces are available in "Live Traces" for 15 minutes regardless of sampling decisions. During this window, you can search and inspect any trace.
-
Retention filters: After 15 minutes, only traces matching your retention filters are indexed and stored. This is where billing kicks in.
The key insight: You can safely set DD_TRACE_SAMPLE_RATE=1.0 to capture everything at the application level. The ingestion sampling rules are applied separately, and you're only billed for traces that are retained beyond the 15-minute window. This means you get full visibility in Live Traces without necessarily paying for long-term storage of every single trace.
The Minimal Viable Setup
Here's the complete working configuration:
"""Minimal DDTrace + Modal service with Datadog APM."""

import asyncio
import os
from pathlib import Path

from modal import App, Image, Secret, concurrent, enter, exit, method

app_name = "my-modal-service"
MODULE_ROOT = Path(__file__).parent.parent.parent.resolve()

# Datadog configuration
DD_SERVICE = app_name
DD_ENV = os.getenv("MODAL_ENVIRONMENT", "dev")
DD_VERSION = "1.0.0"
DD_SITE = os.getenv("DD_SITE", "datadoghq.com")
DD_TAGS = f"env:{DD_ENV},service:{DD_SERVICE}"

# Image with serverless-init + ddtrace
image = (
    Image.debian_slim(python_version="3.11")
    .dockerfile_commands(
        [
            "COPY --from=datadog/serverless-init /datadog-init /app/datadog-init",
            'ENTRYPOINT ["/app/datadog-init"]',
        ]
    )
    .pip_install(
        "ddtrace==4.1.2",
        "structlog>=24.0.0",
    )
    .env(
        {
            "DD_SERVICE": DD_SERVICE,
            "DD_ENV": DD_ENV,
            "DD_SITE": DD_SITE,
            "DD_VERSION": DD_VERSION,
            "DD_TRACE_ENABLED": "true",
            "DD_LOGS_ENABLED": "true",
            "DD_LOGS_INJECTION": "true",
            "DD_RUNTIME_METRICS_ENABLED": "false",
            "DD_SOURCE": "modal",
            "DD_TAGS": DD_TAGS,
            "DD_TRACE_SAMPLE_RATE": "1.0",
        }
    )
)

app = App(name=app_name, image=image)

# Initialize ddtrace + structlog at image import time
with image.imports():
    import structlog
    from ddtrace import patch, tracer

    patch(logging=True)

    def add_modal_context(logger, method_name, event_dict):
        """Add Modal runtime context to all log entries."""
        event_dict["modal"] = {
            "is_remote": os.getenv("MODAL_IS_REMOTE", "0"),
            "environment": os.getenv("MODAL_ENVIRONMENT", "unknown"),
            "region": os.getenv("MODAL_REGION", "unknown"),
            "task_id": os.getenv("MODAL_TASK_ID", "unknown"),
        }
        return event_dict

    def add_datadog_context(logger, method_name, event_dict):
        """Add Datadog trace context for log correlation."""
        current_span = tracer.current_span()
        if current_span:
            event_dict["dd"] = {
                "trace_id": str(current_span.trace_id),
                "span_id": str(current_span.span_id),
            }
        return event_dict

    structlog.configure(
        processors=[
            structlog.stdlib.add_log_level,
            structlog.processors.TimeStamper(fmt="iso"),
            add_modal_context,
            add_datadog_context,
            structlog.processors.JSONRenderer(),
        ],
        logger_factory=structlog.PrintLoggerFactory(),
    )

    logger = structlog.get_logger(__name__)
Key Discovery #1: Serverless-Init + Auto-Instrumentation
I initially tried several approaches:
| Approach | Result |
|---|---|
ddtrace.auto import alone | No traces appeared |
Agentless mode (DD_TRACE_AGENT_URL) | 404 errors, API version incompatibility |
datadog/serverless-init entrypoint | Works |
serverless-init + ddtrace.auto at import time | Best approach |
The serverless-init container runs alongside your code and handles trace forwarding to Datadog's intake API. Without it, traces have nowhere to go. Once serverless-init is the entrypoint, ddtrace.auto works if you enable it at image import time:
with image.imports():
    import ddtrace.auto  # Auto-instrumentation kicks in here
COPY --from=datadog/serverless-init /datadog-init /app/datadog-init
ENTRYPOINT ["/app/datadog-init"]
Important - Modal Secret Naming: Your Modal secret must contain DD_API_KEY (not DATADOG_API_KEY or other variations). The serverless-init agent looks for this specific environment variable to authenticate with Datadog's intake API. A common gotcha is creating a secret with the wrong key name and wondering why traces never appear.
Note: You may see warnings like Workloadmeta collectors are not ready after 20 retries - these are non-fatal and traces still work.
Key Discovery #2: DD_TAGS for Log-APM Correlation
For logs to appear in the APM trace view, you must set DD_TAGS with env and service:
DD_TAGS = f"env:{DD_ENV},service:{DD_SERVICE}"
Without this, logs are captured but won't correlate with traces in the UI.
Required environment variables for correlation:
DD_SERVICE- Service nameDD_ENV- Environment (dev, staging, prod)DD_TAGS- Must includeenv:andservice:DD_LOGS_INJECTION- Set totrue
For the official documentation on connecting logs and traces in Python, see Datadog's Connect Logs and Traces guide.
Key Discovery #3: Explicit tracer.flush() for Real-Time Traces
Modal containers stay warm between invocations. The @exit() lifecycle hook (where I call tracer.shutdown()) only runs on container shutdown, not after each request.
Problem: Traces buffer in memory and only appear in Datadog when the container eventually shuts down.
Solution: Call tracer.flush() after each request, but guard it with finally so early returns and exceptions still emit spans:
@method()
async def process(self, document_id: str) -> dict:
    try:
        with tracer.trace("document.process", service=app_name) as span:
            span.set_tag("document_id", document_id)

            if not document_id:
                return {"error": "missing_id"}  # Early return - still gets flushed

            result = await self._do_work(document_id)
            return result
    finally:
        # Always flush - covers early returns, exceptions, and normal completion
        tracer.flush()
Shutdown pattern: Combine per-request flushing with @exit() shutdown to drain any remaining buffers:
@exit()
async def cleanup(self) -> None:
    tracer.shutdown()  # Drains remaining spans and closes connections
This two-layer approach ensures spans are sent in real-time during normal operation, while shutdown() in @exit() acts as a safety net for any buffered data when the container eventually terminates.
Key Discovery #4: Memory Snapshots Break the Datadog Agent
Modal's enable_memory_snapshot=True can break Datadog's serverless-init agent after a snapshot/restore cycle. I saw spans created locally (trace IDs in logs) but nothing showed up in APM because the agent was no longer reachable.
Symptoms:
- Log lines show
dd.trace_id/dd.span_id, but no traces appear in APM - ddtrace logs:
failed to send, dropping 1 traces to intake at http://localhost:8126/v0.5/traces: timed out SERVERLESS_INITwarnings right after restore
Why it happens: serverless-init runs as the entrypoint process. When Modal snapshots and restores the container, the agent's internal state and sockets may not survive, so the tracer keeps sending to localhost:8126 with no listener.
Fix: Disable memory snapshots on traced classes/functions:
@app.cls(
    enable_memory_snapshot=False,
    secrets=[Secret.from_name("datadog_api_key")],
)
class MyService:
    ...
If you must use snapshots, consider agentless tracing or a separate agent that survives restores. See Modal's Memory Snapshot documentation for more details on how snapshots work.
Key Discovery #5: Concurrent Inputs Impact Trace Sampling
This was my biggest "aha" moment. The Datadog agent samples approximately 10 traces per second by default. With Modal's @concurrent decorator set to max_inputs=128, I was completing 50+ requests in under 3 seconds - overwhelming the sampler.
Symptoms:
- Only 2-5 traces appear from 50 requests
- Traces appear in "Live Traces" but not indexed
- Inconsistent trace visibility
Root cause: Agent-side sampling drops traces when throughput exceeds ~10/sec.
Solutions:
- Reduce concurrency for better sampling visibility:
@app.cls(secrets=[Secret.from_name("datadog_api_key")])
@concurrent(max_inputs=8)  # Reduced from 128
class MyService:
    ...
- Set explicit sample rate (overrides agent sampling):
"DD_TRACE_SAMPLE_RATE": "1.0" # Capture 100% of traces
Tradeoff: Lower concurrency means slower throughput but better observability. For production, consider:
- Using
DD_TRACE_SAMPLE_RATE=1.0for critical services - Accepting sampling for high-throughput services
- Using metrics (not traces) for aggregate performance data
Key Discovery #6: Span Types for Better UI Organization
By default, spans appear as "Custom" in Datadog. Set span_type for proper categorization:
# Root span - entry point
with tracer.trace("document.process", service=app_name, span_type="serverless") as root:
    root.set_tag("span.kind", "server")

    # Child span - template rendering
    with tracer.trace("document.render", service=app_name, span_type="template"):
        ...

    # Child span - LLM inference
    with tracer.trace("document.llm", service=app_name, span_type="llm"):
        ...
Available span types: web, db, cache, worker, http
Key Discovery #7: Structlog with Modal Context
For rich, queryable logs in Datadog, configure structlog with custom processors that inject Modal runtime context:
def add_modal_context(logger, method_name, event_dict):
    """Add Modal runtime context to all log entries."""
    event_dict["modal"] = {
        "environment": os.getenv("MODAL_ENVIRONMENT", "unknown"),
        "region": os.getenv("MODAL_REGION", "unknown"),
        "task_id": os.getenv("MODAL_TASK_ID", "unknown"),
        "image_id": os.getenv("MODAL_IMAGE_ID", "unknown"),
    }
    return event_dict

def add_datadog_context(logger, method_name, event_dict):
    """Add Datadog trace context for log correlation."""
    current_span = tracer.current_span()
    if current_span:
        event_dict["dd"] = {
            "trace_id": str(current_span.trace_id),
            "span_id": str(current_span.span_id),
        }
    return event_dict
This gives you logs like:
{
  "event": "processing_document",
  "level": "info",
  "timestamp": "2026-01-08T10:30:00.000Z",
  "document_id": "doc-123",
  "modal": {
    "environment": "dev",
    "region": "us-east-1",
    "task_id": "ta-01ABC..."
  },
  "dd": {
    "trace_id": "12345678901234567890",
    "span_id": "9876543210"
  }
}
Benefits:
- Filter logs by Modal region, task, or environment
- Correlate logs with specific container instances
- Debug issues across distributed traces
Key Discovery #8: Nested Spans Work Automatically
Child spans inherit parent context automatically - no need for explicit child_of parameters:
with tracer.trace("parent") as parent:
    parent.set_tag("key", "value")

    # Automatically becomes child of parent
    with tracer.trace("child"):
        await do_work()

    # Also a child of parent
    with tracer.trace("another_child"):
        await do_more_work()
The waterfall view in Datadog will show the hierarchy correctly.
Complete Working Example
"""Production-ready DDTrace + Modal service with structlog."""

import asyncio
import os
from pathlib import Path

from modal import App, Image, Secret, concurrent, enter, exit, method

app_name = "document-processor"

DD_SERVICE = app_name
DD_ENV = os.getenv("MODAL_ENVIRONMENT", "dev")
DD_VERSION = os.getenv("GIT_SHA", "1.0.0")
DD_SITE = os.getenv("DD_SITE", "datadoghq.com")
DD_TAGS = f"env:{DD_ENV},service:{DD_SERVICE}"

image = (
    Image.debian_slim(python_version="3.11")
    .dockerfile_commands(
        [
            "COPY --from=datadog/serverless-init /datadog-init /app/datadog-init",
            'ENTRYPOINT ["/app/datadog-init"]',
        ]
    )
    .pip_install("ddtrace==4.1.2", "structlog>=24.0.0")
    .env(
        {
            "DD_SERVICE": DD_SERVICE,
            "DD_ENV": DD_ENV,
            "DD_SITE": DD_SITE,
            "DD_VERSION": DD_VERSION,
            "DD_TRACE_ENABLED": "true",
            "DD_LOGS_ENABLED": "true",
            "DD_LOGS_INJECTION": "true",
            "DD_RUNTIME_METRICS_ENABLED": "false",
            "DD_SOURCE": "modal",
            "DD_TAGS": DD_TAGS,
            "DD_TRACE_SAMPLE_RATE": "1.0",
        }
    )
)

app = App(name=app_name, image=image)

with image.imports():
    import structlog
    from ddtrace import patch, tracer

    patch(logging=True)

    def add_modal_context(logger, method_name, event_dict):
        """Add Modal runtime context to all log entries."""
        event_dict["modal"] = {
            "environment": os.getenv("MODAL_ENVIRONMENT", "unknown"),
            "region": os.getenv("MODAL_REGION", "unknown"),
            "task_id": os.getenv("MODAL_TASK_ID", "unknown"),
        }
        return event_dict

    def add_datadog_context(logger, method_name, event_dict):
        """Add Datadog trace context for log correlation."""
        current_span = tracer.current_span()
        if current_span:
            event_dict["dd"] = {
                "trace_id": str(current_span.trace_id),
                "span_id": str(current_span.span_id),
            }
        return event_dict

    structlog.configure(
        processors=[
            structlog.stdlib.add_log_level,
            structlog.processors.TimeStamper(fmt="iso"),
            add_modal_context,
            add_datadog_context,
            structlog.processors.JSONRenderer(),
        ],
        logger_factory=structlog.PrintLoggerFactory(),
    )

    logger = structlog.get_logger(__name__)


@app.cls(secrets=[Secret.from_name("datadog_api_key")])
@concurrent(max_inputs=8)  # Balance throughput vs trace sampling
class DocumentProcessor:

    @enter()
    def init(self) -> None:
        with tracer.trace("modal.init", service=app_name, span_type="serverless"):
            logger.info("initializing_service")
            self.model = load_model()

    @method()
    async def process(self, document_id: str) -> dict:
        with tracer.trace("document.process", service=app_name, span_type="serverless") as root:
            root.set_tag("document_id", document_id)
            root.set_tag("span.kind", "server")

            with tracer.trace("document.parse", service=app_name, span_type="template"):
                content = await self.parse_document(document_id)

            with tracer.trace("document.extract", service=app_name, span_type="llm") as llm_span:
                llm_span.set_tag("model", "mineru-vl")
                result = await self.extract_fields(content)

        tracer.flush()  # Send traces immediately
        return result

    @exit()
    async def cleanup(self) -> None:
        with tracer.trace("modal.exit", service=app_name, span_type="serverless"):
            logger.info("shutting_down")
        tracer.shutdown()
Summary: Configuration Checklist
| Setting | Value | Purpose |
|---|---|---|
serverless-init | Entrypoint | Trace forwarding |
ddtrace version | 4.1.2 | Tested with Modal |
DD_TRACE_ENABLED | true | Enable tracing |
DD_LOGS_INJECTION | true | Inject trace IDs into logs |
DD_TAGS | env:X,service:Y | Log-APM correlation |
DD_TRACE_SAMPLE_RATE | 1.0 | Override agent sampling |
@concurrent(max_inputs=N) | 8-16 | Balance throughput vs sampling |
tracer.flush() | After each request | Real-time trace visibility |
patch(logging=True) | At import time | Enable log correlation |
Tradeoffs to Consider
-
Concurrency vs Observability: Higher
max_inputs= faster throughput but traces may be sampled out. Lower values give better visibility but slower processing. -
Sample Rate:
DD_TRACE_SAMPLE_RATE=1.0captures everything at the application level, but this doesn't directly increase Datadog costs (see "Understanding Datadog's Sampling Pipeline" above). -
Flush Frequency: Calling
tracer.flush()after every request adds latency (~1-5ms) but ensures real-time visibility. For batch processing, flush periodically instead. -
Container Lifecycle: Modal keeps containers warm, so
@exit()rarely runs. Don't rely on it for trace flushing - use explicittracer.flush().
Further Reading
- Sampling all the way down by Marcus Crane - An excellent deep dive into Datadog's multi-stage sampling pipeline
- Connect Logs and Traces in Python - Official Datadog documentation on log-trace correlation
- Modal Concurrent Inputs - How to handle multiple inputs concurrently in Modal
- Modal Memory Snapshots - Reduce cold start times with container snapshots
This guide is based on hands-on integration work with Modal and Datadog APM. The patterns described here have been tested with ddtrace 4.1.2, Modal's serverless platform, and Datadog's APM service as of January 2026.